FIFA22 App
What is this?
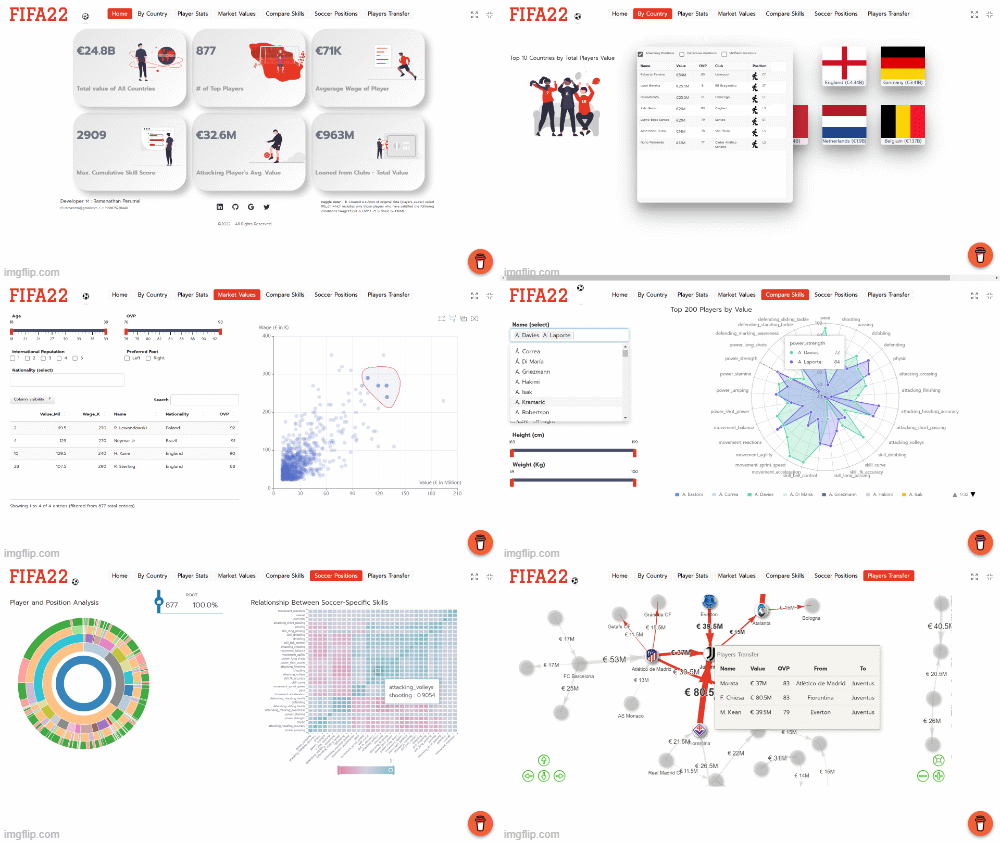
R, HTML, CSS, and JS are an immensely powerful combination for developing and hosting standalone data-analytics web applications. This FIFA22 app demonstrates how to build an RMarkdown application deployed in Netlify using the GitHub repo.
Why this Dashboard ?
RShiny has been successfully applied to many sports analytics dashboards. However, there has not been much application of standalone RMarkdown dashboards in sports analytics, though RMarkdown is generally used for PDF/simple HTML report generations.
This provides us an unique opportunity to explore opensource data resources with the use of suitable visualization techniques to gain insight into the evaluation of soccer player and team analytics.
Kaggle made a comprehensive dataset for FIFA22 publicly available, which contains detailed statistics for all players involved in each match.
Complex nature of soccer games, it is difficult to decide upon a suitable set of attributes that can be used to evaluate an individual player’s performance. These analytics dashboards enable the coach, players, and the managers to objectively assess and thereby improve their performance.
What we aim for?
- Find out most important attributes of player’s skillset which determine their value and wages
- Compare the skillsets of two competing players/teams
- Correlation analytics of player performance metrics.
- Network maps for player transfers between clubs
Here we attempt to figure out the best ways to aggregate our DataViz pages so that it results in a set of storylines such that these player/team performances define the insights as much as possible.
Full App: FIFA22 App

caption