Netflix Content Analytics
Welcome to the Netflix Content Analytics - RMarkdown Dashboard showed on this link :).
It will convince you how to utilize the amazing R packages [crosstalk, plotly, reactable, visNetwork, etc.] producing the interactive data visualization and standalone dashboards (without the Shiny support!).
Switch between dark and light mode with CSS and JavaScript.
Full App: Netflix App
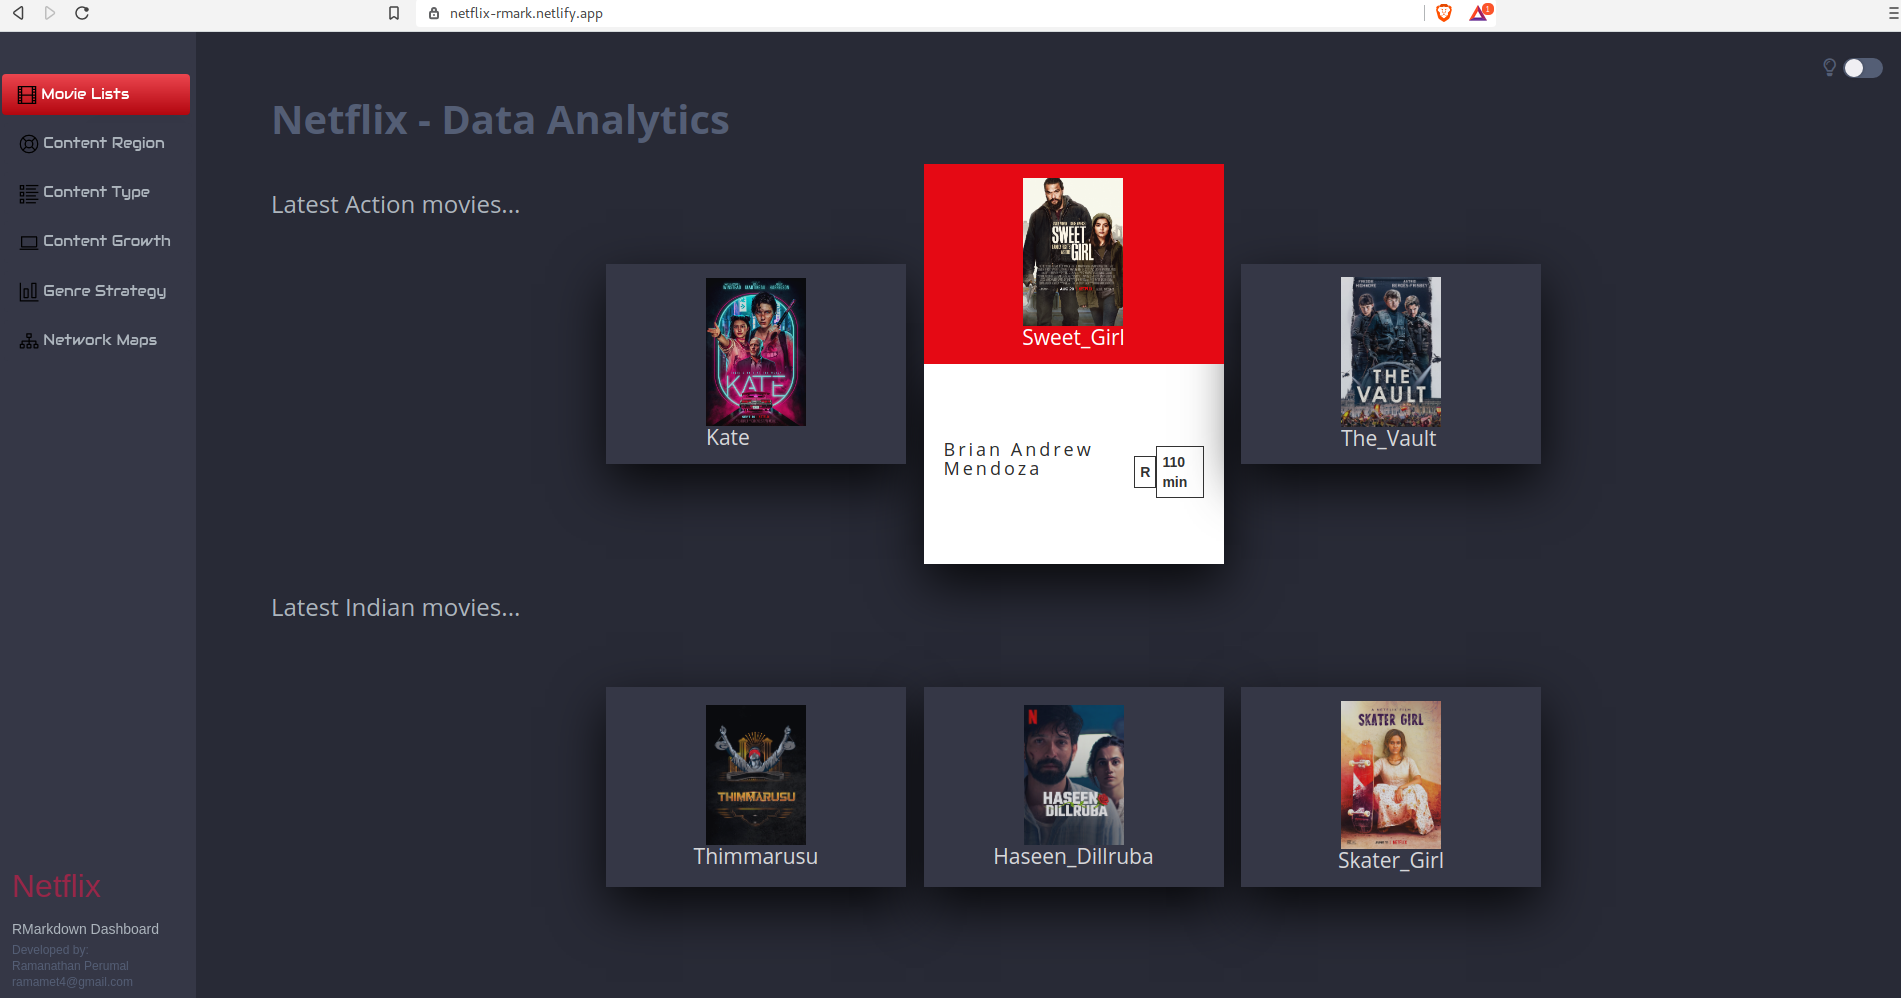
caption