World Health Statistics
R Markdown Dashboard
R Markdown is used here to wrap up all the data analytics code and outputs (figures, tables, etc) together in a dynamic document that can be published as a static dashboard (lightweight Shiny App- without serverside processing!!) in Netlify hosting. Particularly powerful when combined with the interactive graphs and tables presented using the crosstalk library.
Full App: Health App
caption
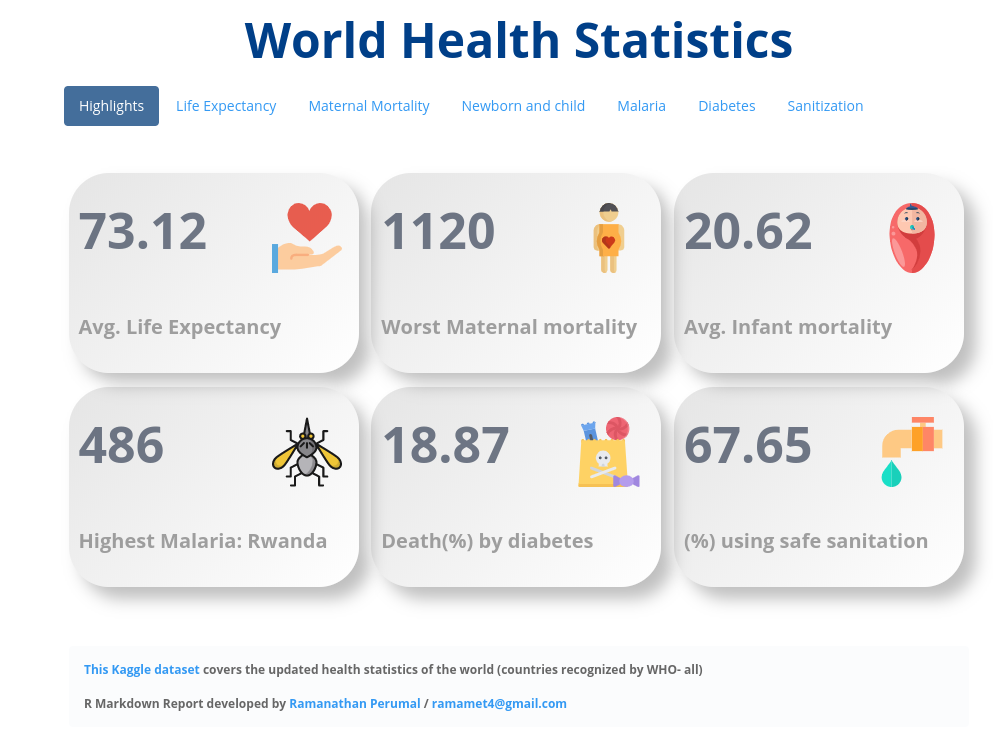
This Kaggle dataset covers the updated health statistics of the world (countries recognized by WHO- all)
R Markdown Report developed by Ramanathan Perumal / ramamet4@gmail.com / Linkedin